.NET metric APIs in 2023
At this point in time, .NET comes with three different metric APIs, with System.Diagnostics.Metrics being the most recent one.
But what are metrics? Why are there so many different APIs, and which one should you choose? Let's try to find out!
What are metrics?
Metrics are used to monitor an application's performance and health and are basically just numerical measurements reported over time.
Common metric examples are "cpu usage", "memory usage", "open connections", "requests/s" and so on.
There are typically two use cases for metrics in applications:
- Instrumentation: Measuring and associating those measurements with a metric name (as seen in the .NET runtime).
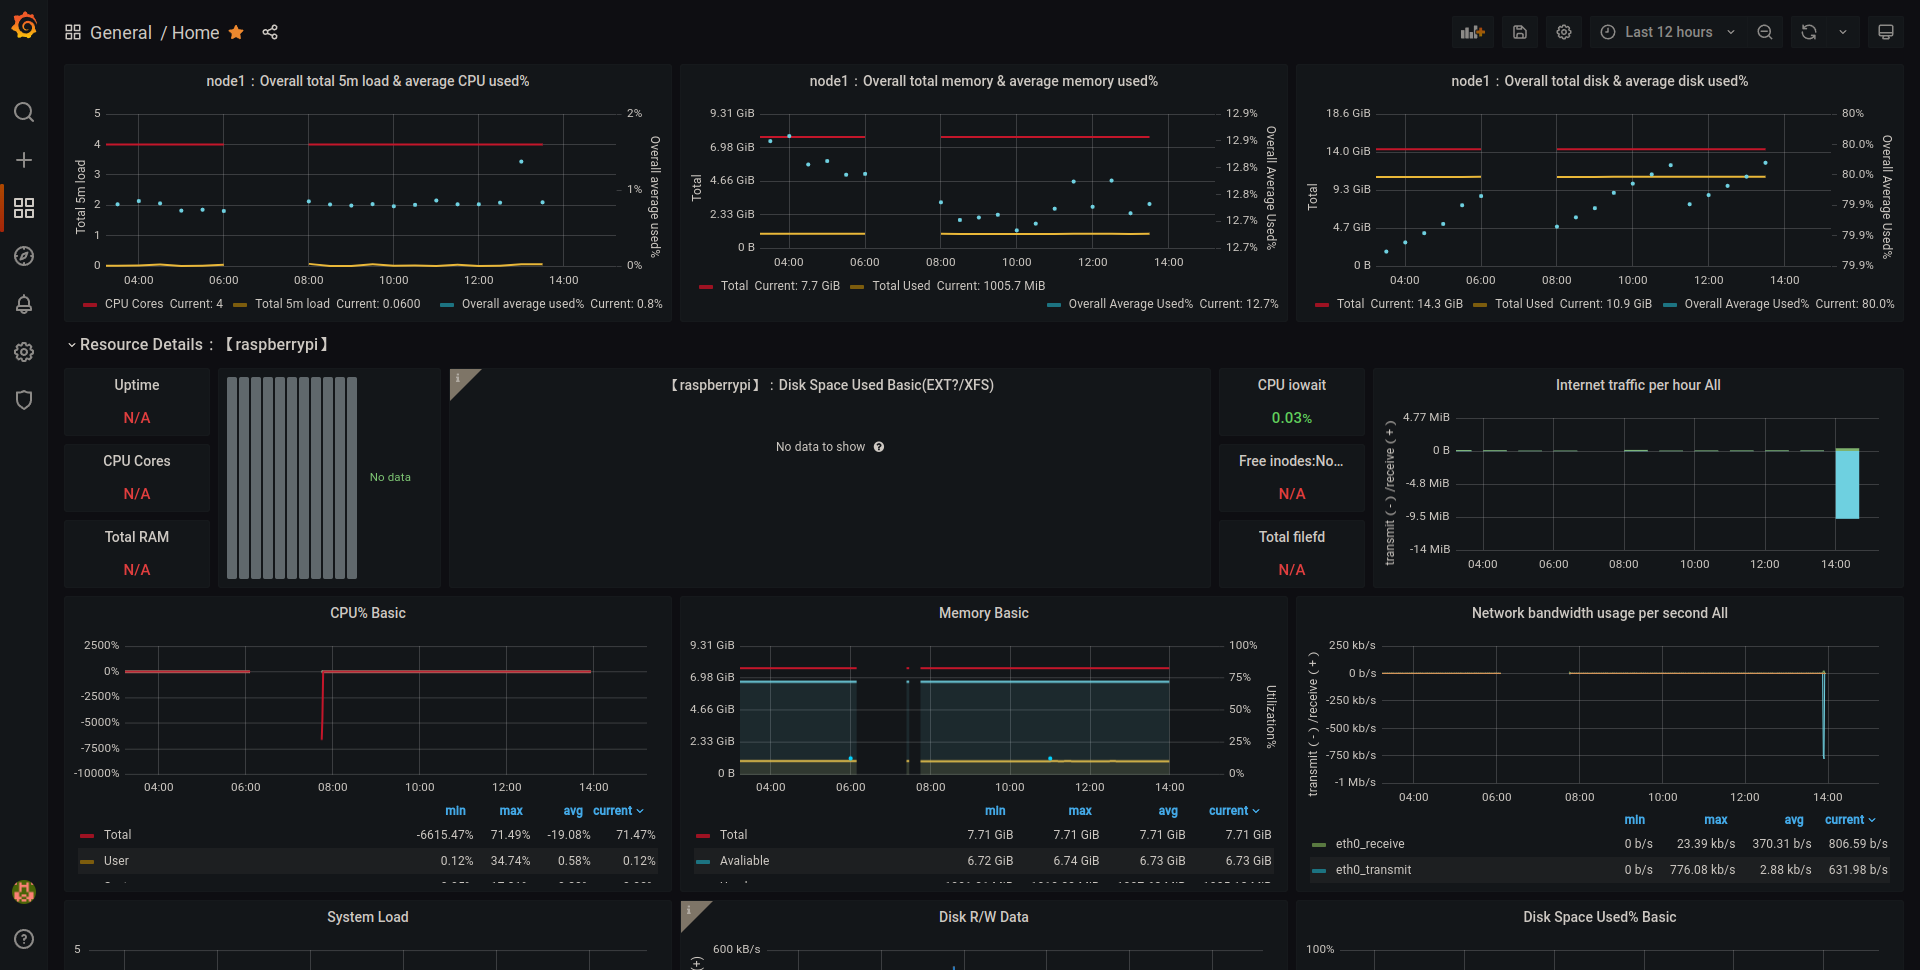
- Collection: Collecting application metrics to provide them for external storage and analysis/visualization (e.g., with Prometheus and Grafana).
... in conclusion
Your web application could collect relevant metrics and publish them to an APM (Application Performance Monitoring) endpoint. This would allow a monitoring solution like
Prometheus or VictoriaMetrics to scrape your metrics endpoint at a specified interval and store those values in an external database.
The external (time series) database could then act as a data source for tools like Grafana, with which you can easily build dashboards on top of your recorded data.
This will allow you to monitor your application and even configure simple alerting so that you can get notifications if your system isn't in a healthy state.
Since your web application always only reports the most recent value, the monitoring solution is in charge of scraping the data and storing it in a time series database.
Also, the visualization part is not a concern of your operative application, which leaves it with a rather small performance overhead in comparison to other monitoring approaches.
.NET metric APIs
If you only want to learn about the most recent cross-platform .NET metric API and do not care about the other APIs, you can skip right to the System.Diagnostics.Metrics-API,
as it is what Microsoft recommends for new applications at the moment.
If you are interested in all the currently supported and stable APIs and how they can be used, I'll go through them chronologically,
starting with the oldest one - the Performance Counter API.
Performance Counters
The .NET PerformanceCounter class can be used to easily access Windows performance counters, which provide a consistent interface for collecting system data like disk usage,
memory usage, or processor statistics.
What's even better for .NET developers is that IIS, ASP.NET, and .NET publish their metrics via Windows performance counters too, allowing us to get access to
useful metrics like "current connections", "requests/s", and much more directly from there.
There are many ways to look up the available performance counters on your system, like listing them via the PerformanceCounterCategory.GetCategories method
or using the Windows performance monitor:
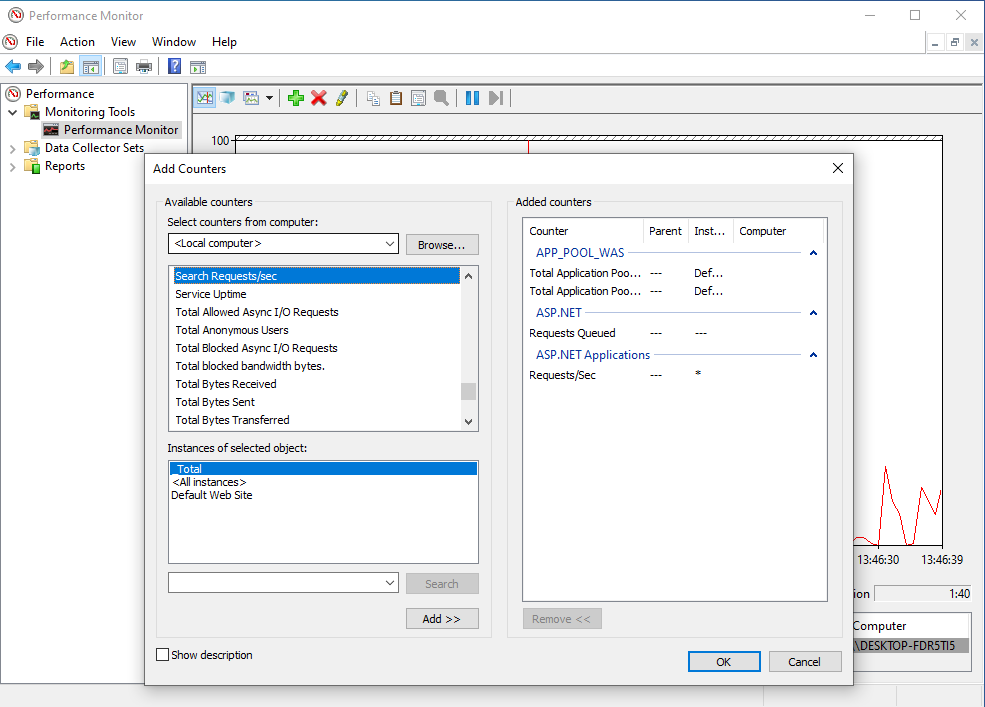
Reading values from performance counters works the same way as selecting a counter from the Performance Monitors UI.
You need to provide the category name, the counter name, and optionally an instance name:
    using System.Diagnostics;

    var counter = new PerformanceCounter("Processor", "% Processor Time", "_Total");

    while (true)
    {
        Console.WriteLine("Value: {0}", counter.NextValue());
        Thread.Sleep(1000);
    }
As mentioned earlier, this is the oldest metrics API, which is primarily provided for compatibility these days.
Microsoft does not recommend this API for new projects, unless the project is Windows-only and you really want to use Windows Performance Counters for your project.
Performance counters are consumed by Microsoft-provided tools like the Task Manager and the Resource Monitor.
Event Counters
The Event Counters API is the successor of the Performance Counter API with cross-platform support and was introduced starting with .NET Core 3.0.
Event counters are also utilized by the .NET runtime and core .NET libraries for publishing basic diagnostic information.
The main difference compared to the performance counter is that event counters are, as the name suggests, events that are published by an event source.
Those events can be consumed in almost real-time by event listeners (in-process) or external tools (out-of-process) via ETW (Event Tracing for Windows) or Event Pipe for cross-platform applications.

If you want to consume those event counters, you can try that with one of the following tools:
Event counters can also be easily consumed by other monitoring solutions, especially Azure Application Insights.
Microsoft provides a list of well-known EventCounters in .NET that you should definitely check if you are interested in this topic.
There you will find counters for the .NET runtime (e.g., cpu-usage), ASP.NET Core (e.g., current-requests), ASP.NET Core Kestrel web server (e.g., connections-per-second)
as well as counters for the HTTP stack (e.g., requests-failed-rate) and much more.
If you want to retrieve and display those metrics in your application, you have to write an event listener, which makes using this API a bit more complicated
than using the Performance Counter API.
Documentation on how to do that can be found in Microsoft's diagnostic repository.
System.Diagnostics.Metrics
Last, but not least, there is Microsoft's implementation of the OpenTelementry Metrics API, a cross-platform metrics API that comes with new features like
multi-dimensional metrics and a strongly typed high-performance listener API, and is the successor of the event counters.
It is fairly easy to add your own metrics to an ASP.NET Core application with the System.Diagnostics.Metrics API, as this example demonstrates.
You basically have to create a System.Diagnostics.Metrics.Meter with a name and, optionally, a version, add a (for instance) counter via the CreateCounter-function and that's it.
After that, you can increment the counter and add a Prometheus exporter via the OpenTelemetry.Exporter.Prometheus.HttpListener package for data scraping.
If you want to observe measurements recorded by the System.Diagnostics.Metrics.Meter in-process, you can use a similar approach to consuming event counters by using a MeterListener implementation.
An up-to-date example of how to do that in detail can be found here.
Conclusion
.NET comes with three stable metrics APIs, of which two are cross-platform compatible.
Although performance counters will be supported for backward compatibility and event counters are still widely used, Microsoft strongly advises developers to
use the new System.Diagnostics.Metrics APIs that were designed in collaboration with the OpenTelemetry project.
Even if it seems to be easier to get data from Windows Performance Counters, the event-driven approach of the newer APIs comes with many advantages and
allows near real-time consumption of measurement changes in- and out-of-process.
I hope this post gave you a brief overview of the currently available .NET metrics APIs and their current state.
Sources / relevant links:
- MS Learn - About Performance Counters
- MS Learn - EventCounters in .NET
- MS Learn - Well-known EventCounters in .NET
- GitHub - .NET Runtime Issue #21983 - Event Counters (WIP)
- GitHub - How to measure performance using EventCounters
- MS Learn - Metrics Comparison
- MS Learn - System.Net Metrics
- MS Learn - Collect metrics